2013-09-03

On learning (math, in particular)

Here are some bon mots I collected from an online course on math didactics.

When you had the answer wrong, your brain grew…

… when you got the answer right, nothing happened to your brain. This aims to build a work ethic. Dave Panesku tried different starting messages at Khan Academy Videos. Messages that tried to build work ethic (“the more you work, the more you learn”) made students solve more problems, while encouraging messages (“this is hard, try again if you fail first time”) had no effect compared to the control group.

It is also about appreciating mistakes.

Convince yourself, convince a friend, convince a skeptic

Most math students and their parents have difficulties to name the topic or learning goal that is currently covered in class. Discussing different ways of seeing, different paths and strategies to tackle a problem, however, is what learning (math, in particular) is about.

Uri Treisman and his colleagues showed in their minority studies [1] that students who discussed the problems outperformed those who did not.

Where are you, where do you need to be, how to close the gap

Feedback is important. Regular peer and self assessments outperforms control groups, especially low achievers improve [2].

Grading does not provide useful feedback. Diagnostic feedback encourages the students and outperforms grades – as well as grades together with feedback [3].

Pseudo-context problems need redesign

Math problems can be fun if they are presented in an open style that allows multiple entry points.

It is more interesting to construct two rectangles given a perimeter than to find the perimeter of a given rectangle.

“Doing and undoing”, i.e. being able to reason both forwards and backwards with operations, is the central practice in algebraic thinking. For instance, first discuss several methods to solve a problem, then present expressions for new methods and discuss what the method behind the expression might be [4].

There is an web effort on makeover of dull math problems.

Can you do any number between 1 and 20 by using only 4 4s? For example, 20 = (4/4 + 4)*4.

  1. Fullilove, R. E., & Treisman, P. U. (1990). Mathematics achievement among African American undergraduates at the University of California, Berkeley: An evaluation of the Mathematics Workshop Program. Journal of Negro Education, 59 (30), 463-478.
  2. White, B., & Frederiksen, J. (1998). Inquiry, modeling and metacognition: making science accessible to all students. Cognition and Instruction, 16(1), 3-118.
  3. Butler, R. (1988). Enhancing and Undermining Intrinsic Motivation: The Effects of Task-Involving and Ego-Involving Evaluation on Interest and Performance. British Journal of Educational Psychology, 58, 1-14.
  4. Driscoll, M. (1999). Fostering Algebraic Thinking: A Guide for Teachers, Grades 6-10. Heinemann, 361 Hanover Street, Portsmouth, NH 03801-3912.

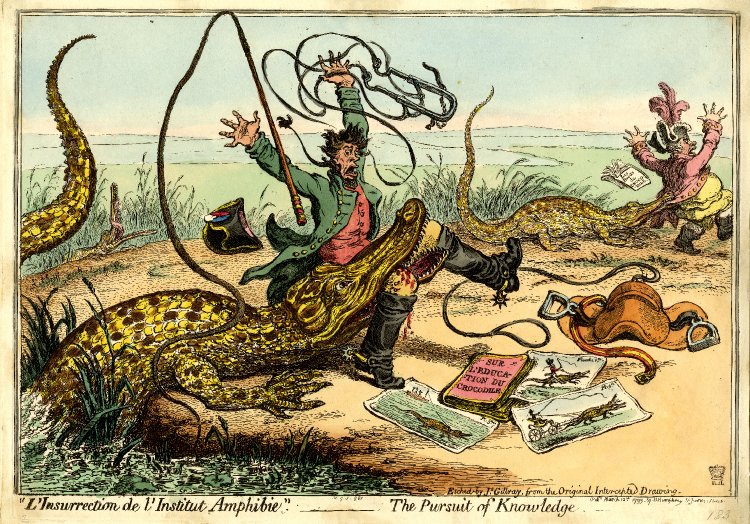
Gillray on knowledge gained from books

James Gillray, L'Insurrection de l'Institut Amphibie -- The Pursuit of Knowledge (1799)

Have a look at the figure above. In the image we see an experiment that goes terribly wrong. Two persons want to transfer their knowledge on horses and try to domesticate crocodiles. We see a whip, a bridle, a saddle and an instruction manual “education for crocodiles”. But crocodiles are not horses, they bite back, and turn the scene into a blood bath.

200 years later it is still true

Gillray created this caricature in 1799, and it was a comment on politics. It relates to personal letters from enraged French officers in Bonaparte's Egyptian command [1]. It is the trait of a caricature to exaggerate its subject and should of course be interpreted metaphorically. The crocodiles may represent the Egypt people Bonaparte tried to subordinate as he did in many Europian countries. On the other hand, the exaggeration, which is also an abstraction, allows us to take the image out of its context and apply it to other situations. Here come two examples.

My first encounter with this image was at an exhibition on the “Age of Reason”. The topic of that exhibition was the time of the transition from religion to science that took place at the end of the 18th century: The first anatomy atlas of the inside of the human body appeared, the earthquake of Lissabon shattered faith in god, and it was the time of the French revolution. In this context, Gillray's caricature appears as a critic of the new stream of thought at that time. Maybe the people overused the scientific method in the first enthusiasm, and rather than seeing the object openly and attentively with some kind of wonder, the persons in the picture simply apply the knowledge they read in books. This goes wrong, and maybe this overacting, this trying-too-hard, is why the age of reason entered eventually the age of Romanticism, which prized intuition, emotion and imagination over the scientific rationalism.

Today, some people are very enthusiastic about data. They proclaim the age of dataism: cheap storage and lots of mobile sensors everywhere lead to huge amounts of data and many new insights. However, Gillray's caricature can serve as a warning here. Some problems will not be tamed and utilized with the right dataset and some analysis method, but will bite back.

  1. Draper Hill Fashionable Contrasts. Caricatures by James Gillray, Phaidon Press, 1966

2013-06-06

A common ground for Quantified Self enthusiasts

Today I joined a Quantified Self meetup at the Google Office here in Berlin. I have to say I don't like the direction this “movement” is taking.

I think what is missing is a common ground, an inspiring basis everyone likes, trusts and participates. Something like the Raspberry Pi, Wordpress, Wikipedia or Apache, – something you can build on.

The talks today were quite the opposite. Someone showed an application which is now free but will likely become crippled when the user base is large enough. Someone else plans a web site for blood tests per mail. Thank you, not for me.

2013-05-29

Google Reader Shutdown -- what now?

When Google announced they stop their Reader service, I felt both old and embarassed. Suddenly, I was one of the few people who use this outdated RSS technology. What trend did I miss this time, and which service will Google stop next? Feedburner? Blogger?

There are some features of Google Reader that were really helpful: access from multiple computers and mobile phone, tag the feeds, star blogposts I want to use later, recommend blogpost via my personal feed (or later via G+), search my marked or recommended items or all feeds, find feeds similar to my subscribed ones, get some statistics on my usage behaviour, etc. For free.

Now it is only four weeks to shutdown and I still do not know what to do. Here is what I researched up to now.

Alternative online services

As far as I can see, the online alternatives on the market do not have all these features. Feedly looks promising, but in its current state it is simply a layer on Google Reader, and who knows how they manage the switch. However, it is reassureing that already 1.4 million Chrome user installed this tool, so there is reason to believe RSS is not dead.

Online services claim the convienence of “access from everywhere”. This is true only for places with internet (the Berlin subway, where I like to read RSS news is not very reliable in this aspect), and it comes with a cost, such as data privacy (not a big issue when it comes to news) or limited access (for instance, Google Takeout gives only subscriptions, not the news feed itself). This is why I looked for locally installed programs that fit my needs.

Offline?

Calibre is an ebook reader program I use to maintain my PDF collection. It has a news feature, where web pages including RSS feeds can be downloaded and – highly customizable – converted to various formats (txt, pdf, epub). Calibre can be set up as local server and the smartphone app FBReader is able to connect to it. The idea is nice, but the conversion from RSS to EPUB for over 450 feeds would take some time. Also, conversion is not always smooth. For instance, large images such as XKCD comics become hardly readable.

Another interesting offline reader is makagiga, which adds to-do list features to the newsreader functionality. However, no smartphone support as far as I can see.

Not a real option in general, but useful for certain tasks like scraping EEX data is to use a programming language with a suitable extension library, such as R's tm.plugin.webmining package.

Conclusions? Not yet

Maybe I do not feel comfortable with any of these services and programs because my trust is shaken. Maybe it is hard to give up / change habits. Whatever it is, I still have not made my mind up what to do when Google Reader shuts down. What do you do?

2013-05-17

Unit conversion in R

Last weekend I submitted an update of my R package datamart to CRAN. It has been more than a half year since the last update, however there are only minor advances. The package is still in its early stages, and very experimental.

One new feature is the function uconv. Think iconv, but instead of converting character vectors between different encodings, this function converts numerical vectors between different units of measurements. Now if you want to know how many centimeters one horse length is, you can write in R:

> #install.packages("datamart")
> library(datamart)
> uconv(1, "horse length", "cm")

and you will get the answer 240. I had the idea for this function when I had to convert between various energy units, including natural units of energy fuels like cubic metres of natural gas. The uconv function supports this, using common constants for the conversion.

> uconv(1, "Mtoe", "PJ")
[1] 41.88
> uconv(1, "m³ NG", "kWh")
[1] 10.55556

These conversions may be ambigious. For instance, the last one combines a volume and an energy dimension. An optional parameter allows the specification of the context, or unitset:

> uconv(1, "Mtoe", "PJ", uset="Energy")

The currently available unit sets and units therein can be inspected with

> uconvlist()

The first argument can be a numerical vector:

> set.seed(13)
> uconv(37+2*rnorm(5), "°C", "°F", uset="Temperature")
[1] 100.59558  97.59102 104.99059  99.27435 102.71309

2013-05-11

Highlights of Re:publica 13

From May 6th to 8th, Berlin was the host for the re:publica 13. I did not have time to attend it, but many of the talks of this internet culture conference are online. Here are my highlights (mostly in German, though):

2013-02-16

Some of Excel's Finance Functions in R

Last year I took a free online class on finance by Gautam Kaul. I recommend it, although there are other classes I can not compare it to. The instructor took great efforts in motivating the concepts, structuring the material, and enable critical thinking / intuition. I believe this is an advantage of video lectures over books. Textbooks often cover a broader area and are more subtle when it comes to recommendations.
One fun excercise to me was porting the classic excel functions FV, PV, NPV, PMT and IRR to R. Partly I used the PHP class by Enrique Garcia M. You can find the R code at pastebin. By looking at the source code, you will understand how sensitive IRR to its start value is:
> source("http://pastebin.com/raw.php?i=q7tyiEmM")
> irr(c(-100, 230, -132), start=0.14)
[1] 0.09999995
> irr(c(-100, 230, -132), start=0.16)
[1] 0.1999999
I still do not understand the sign of the return values. This I have to figure out every time I use the function. If you have a memory hook for this, please leave a comment.
The class did of course not only cover the time value of money, it was also a non-rigorous introduction to bonds and perpetuities (which I found interesting, too), as well as to CAPM and portfolio theory.

2013-02-14

Reflections on a Free Online Course on Quantitative Methods in Political Sciences

Last year I watched some videos of Gary King's lectures on Advanced Quantitative Research Methodology (GOV 2001). The course teaches ongoing political scientists how to develop new approaches to research methods, data analysis, and statistical theory. The course material (videos and slides) seems to be still online, a subsequent course apparently has started end of January 2013.

I only watched some videos and did not work through the assignments. Nevertheless I learned a lot, and I am writing this post to reduce my pile of loose leafs (new year's resolution) and summarize the take-aways.

Theoretical concepts

In one of the first lessons, the goals of empirical research are stepwise partitioned until the concept of counterfactual inference appears, a new term for me. It denotes “using facts you know to learn facts you cannot know, because they do not (yet) exist” and can further differentiated into prediction, what-if analysis, and causal inference. I liked the stepwise approximation) to the concept: summarize vs. inference, descriptive inference vs. counterfactual inference.

In the course was presented a likelihood theory of inference. New to me was the likelihood axiom which states that a likelihood function L(t',y) must be proportional to the probability of the data given the hypothetical parameter and the “model world”. Proportional means here a constant that only depends on the data y, i.e. L(t',y) = k(y) P(y|t'). Likelihood is a relative measure of uncertainty, relative to the data set y. Comparisons of values of the likelihood function across data sets is meaningless. The data affects inferences only through the likelihood function.

In contrast to likelihood inference, Bayesian inference models a posterior distribution P(t'|y) which incorporates prior information P(t'), i.e. P(t'|y) = P(t') P(y|t')/P(y). To me, it seems the likelihood theory of inference is more straightforward as it is not necessary to treat prior information P(t'). I have heard that there discussions between “frequentists” and “Bayesians”, but it was new to me to hear from a third group “Likelihoodists”.

Modeling

At the beginning of the course, some model specifications with “systematic” and “stochastic” components were introduced. I like this notation, it makes very clear what goes on and where the uncertainty is.

An motivation was given of the negative binomial distribution as a compounding distribution of the Poisson and the Gamma distribution (aka Gamma mixture). The negative binomial distribution can be viewed as a Poisson distribution where the Poisson parameter is itself a random variable, distributed according to a Gamma distribution. With g(y|\lambda) as density of the Poisson distribution and h(\lambda|\phi, \sigma^2) as density of the Gamma distribution, the negative binomial distribution f arises after collapsing their joint distribution: f(y|\phi, \sigma^2) = \int_0^+\infty g(y|\lambda) h(\lambda|\phi, \sigma^2) d\lambda

There were many other modeling topics, including missing value imputation and matching as a technique for causal inference. I did not look into it, maybe later/someday.

The assignments did move very fast to simulation techniques. I did not work through them, but got interested in the subject and will work some chapters of Ripley's “Stochastic Simulation” book, when time permits.

Didactical notes

I was really impressed by the efforts Mr. King and his teaching assistants took to teach their material. Students taking the (non-free) full course prepare replication papers. The assignments involve programming. In the lectures quizzes are shown, the students vote using facebook and the result is presented two minutes later. The professor interrupted his talk once per lecture and said “Here is the question; discuss this with your neighbour for five minutes”. Very good idea.